The gap between what Nepal approves and what actually arrives as real capital is not a rounding error or a timing quirk, it is the single most important fact to understand before drawing any conclusion from an FDI announcement, and it is large enough, and persistent enough, that Nepal Rastra Bank now tracks and reports on it explicitly.
The headline number, in full
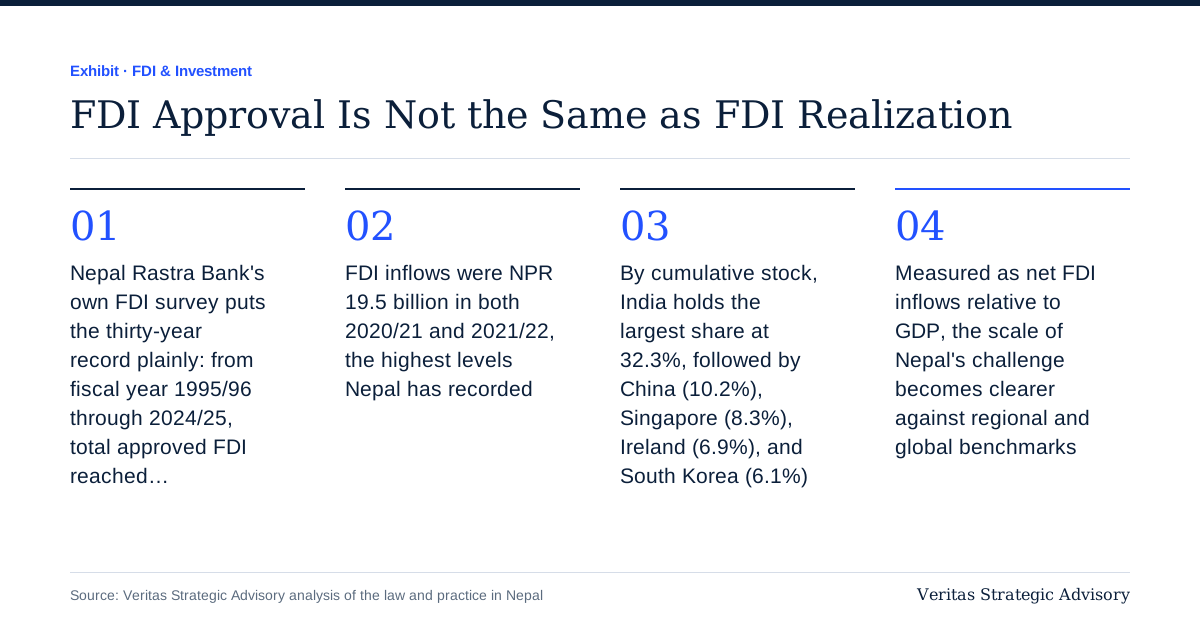
Nepal Rastra Bank's own FDI survey puts the thirty-year record plainly: from fiscal year 1995/96 through 2024/25, total approved FDI reached approximately NPR 577 billion. Actual net FDI inflows over that same thirty-year period came to only around NPR 170.9 billion. (Nepal Rastra Bank, Foreign Direct Investment in Nepal 2024/25)
| Thirty-year record (FY 1995/96 – 2024/25) | NPR (billion) |
|---|---|
| Total FDI approved | 577.0 |
| Total FDI realized (net inflow) | 170.9 |
| Realization rate | 29.6% |
Less than a third of everything Nepal has approved for foreign investment over three decades has ever actually turned into real capital in the country. The most recent fiscal year makes the point even more starkly.
| FY 2024/25 | NPR (billion) |
|---|---|
| FDI approved | 65.0 |
| Net FDI inflow (realized) | 7.3 |
| Realization rate | 11.25% |
An 11.25% realization rate in the most recent year, well below the thirty-year average, is the number that should actually anchor any reading of Nepal's current FDI environment, not the NPR 65 billion approval figure that tends to make the news.
Why this gap exists, and why it is not simply "bureaucracy"
Nepal Rastra Bank attributes the gap to several specific, structural factors, not to a single cause, and each one has a different implication for how the number should be read.
Approval reflects intent, not committed capital. A Department of Industry approval is a regulatory green light for an investment plan, not a binding transfer of funds. An investor can secure approval and then delay, scale down, or in some cases never proceed with the actual remittance, for reasons entirely outside Nepal's control, a shift in the investor's own financing, a change in global capital availability, or a reassessment of the project's returns.
Long time lags between approval and fund transfer are structurally normal, not exceptional. Especially for larger projects, the period between approval and the actual inflow of capital can run to several years, which means any single year's approval figure and that same year's realized inflow are not even measuring the same cohort of projects; a portion of a given year's realized inflow is capital approved years earlier finally arriving.
Hydropower and other capital-intensive sectors realize incrementally, not at once. A hydropower project approved at a large headline value is typically funded in tranches over the multi-year construction period, not as a single upfront transfer, so the approval figure for a hydropower-heavy year can look large while the realized inflow in that same year remains modest, with the balance arriving gradually over subsequent years. (Nepal Rastra Bank, FDI in Nepal 2024/25)
None of these factors describes a corrupt or dysfunctional system; each is a genuine, explainable feature of how cross-border capital actually moves. What they do mean, collectively, is that the approval figure on its own tells you almost nothing about how much real capital is actually entering the country in a given year, and treating it as if it did is a specific and common analytical error.
The recent year-on-year pattern is volatile, not just structurally low
FDI inflows were NPR 19.5 billion in both 2020/21 and 2021/22, the highest levels Nepal has recorded. Gross FDI inflows then fell 59.6% to NPR 7.8 billion in 2022/23, a sharp single-year decline, before settling at NPR 7.3 billion in 2024/25. (Rising Nepal Daily, FDI inflows fall by two-thirds) FDI stock, the cumulative total of foreign investment held in Nepal, stood at NPR 340 billion as of mid-July 2025, having grown only 2.1% over the year. (English Nepalnews, Nepal's FDI: Rs 340 billion stock)
| Fiscal year | Gross/net FDI inflow (NPR billion) |
|---|---|
| 2020/21 | 19.5 |
| 2021/22 | 19.5 |
| 2022/23 | 7.8 (−59.6% year-on-year) |
| 2024/25 | 7.3 |
A decline of this magnitude, roughly two-thirds off the 2020/21–2021/22 peak, sustained across multiple years rather than a single bad year, is the pattern any serious reading of Nepal's investment climate needs to explain, and it is a materially more useful number for that purpose than the approval figure most headlines lead with.
Where the capital that does arrive actually goes
Nepal's FDI stock is concentrated in three sectors of roughly comparable size: manufacturing holds NPR 94.5 billion (27.8% of total stock), electricity, gas, steam and air conditioning, in practice principally hydropower and energy, holds a nearly identical NPR 94.3 billion (also 27.8%), and financial and insurance services follow closely at NPR 89.4 billion (26.3%). (English Nepalnews, Nepal's FDI stock breakdown)
| Sector | FDI stock (NPR billion) | Share of total stock |
|---|---|---|
| Manufacturing | 94.5 | 27.8% |
| Electricity, gas, energy (hydropower) | 94.3 | 27.8% |
| Financial & insurance services | 89.4 | 26.3% |
Within services specifically, tourism-related FDI grew steadily to USD 180.04 million in FY 2024/25, while manufacturing, energy, and broader infrastructure inflows were considerably more volatile year to year, with a notable spike in FY 2023/24 followed by a sharp decline in FY 2024/25, consistent with the lumpy, tranche-based realization pattern described above for capital-intensive projects.
Where the capital comes from
By cumulative stock, India holds the largest share at 32.3%, followed by China (10.2%), Singapore (8.3%), Ireland (6.9%), and South Korea (6.1%). Looking instead at recent commitments in FY 2024/25 specifically, the ranking shifts noticeably: China accounted for the largest share of new commitments at 44.77%, followed by India at 19.55%, then Hong Kong (5.36%), South Korea (4.61%), the United States (3.47%), and the United Kingdom (2.54%).
| By cumulative stock | Share | By FY 2024/25 commitments | Share |
|---|---|---|---|
| India | 32.3% | China | 44.77% |
| China | 10.2% | India | 19.55% |
| Singapore | 8.3% | Hong Kong | 5.36% |
| Ireland | 6.9% | South Korea | 4.61% |
| South Korea | 6.1% | USA | 3.47% |
| UK | 2.54% |
The gap between the stock ranking and the recent-commitment ranking is itself informative: India's dominant historical position reflects decades of accumulated investment, while China's much larger share of recent commitments suggests a shift in which country is currently the more active new entrant, a trend worth watching over the next several fiscal years rather than reading as already established.
What actually counts as "FDI": the three components
Nepal Rastra Bank, following international statistical standards, divides FDI stock into three distinct components, and the 2024/25 data shows these three moving in sharply different directions, which is itself a more informative story than the 2.1% headline stock growth suggests. (Nepal Rastra Bank, FDI in Nepal 2024/25)
| FDI component | FY 2024/25 movement |
|---|---|
| Paid-up (equity) capital | +9.2% |
| Reinvested earnings | +2.6% |
| Intercompany loans | −28.1% (from ~NPR 41.9bn to ~NPR 30.1bn) |
This composition matters more than the net 2.1% headline. Genuinely new equity capital grew a healthy 9.2%, a real positive signal of fresh investor commitment. But intercompany loans, foreign parent companies lending to their Nepalese subsidiaries, fell by more than a quarter, and it was this decline that dragged the net stock growth down to a modest 2.1% overall. A business or analyst reading only the 2.1% headline would miss that the underlying equity story is considerably more positive than the aggregate number suggests, while the financing story, foreign parents becoming more cautious about extending intercompany credit to their Nepalese operations, is the specific piece actually worth watching into the next fiscal year.
How Nepal's FDI performance compares regionally
Measured as net FDI inflows relative to GDP, the scale of Nepal's challenge becomes clearer against regional and global benchmarks. Nepal's FDI net inflows stood at approximately 0.13–0.36% of GDP in 2024, depending on the specific data vintage used, against a world average of 4.17% of GDP. Vietnam, frequently cited as the regional benchmark for FDI-led manufacturing growth, recorded FDI net inflows of roughly 4.2% of GDP in 2024, more than ten times Nepal's rate; India, a much larger and more diversified economy, recorded around 0.7% of GDP. (World Bank, FDI net inflows % of GDP, Nepal)
| Country | FDI net inflows, % of GDP (2024) |
|---|---|
| World average | 4.17% |
| Vietnam | ~4.2% |
| India | ~0.7% |
| Nepal | ~0.13–0.36% |
Vietnam's comparison is instructive specifically because it followed a path Nepal has openly stated it wants to replicate: using earlier decades of aid and infrastructure investment to build the conditions, ports, power, a trained workforce, that later made it a credible destination for large-scale manufacturing FDI. Nepal's FDI-to-GDP ratio sitting at roughly one-thirtieth of Vietnam's is not a reflection of a single policy failure, but it is a concrete, quantified measure of the distance between where Nepal's investment climate is today and where a genuinely FDI-driven manufacturing strategy would need it to be.
What would actually close the gap
Reading the mechanics above together points to a small number of specific, structural levers, not a general call for "more investor confidence":
Faster, more predictable approval-to-registration timelines directly shorten the multi-year lag between approval and realized inflow described earlier. The budget's own newly introduced 30-day investment approval mechanism, covered in our companion piece on what the 2083/84 budget actually means for businesses, is a direct, testable response to exactly this problem; whether it meaningfully improves the realization rate in the coming fiscal years is one of the clearest indicators to watch for whether this specific reform is working in practice, not just on paper.
Stabilising intercompany financing conditions matters as much as attracting fresh equity, given that the 28.1% decline in intercompany loans was the single largest drag on 2024/25 stock growth. This points toward the financial-sector and credit conditions foreign parent companies assess when deciding whether to extend, or withdraw, intercompany credit to their Nepalese operations, a dynamic connected to the domestic credit and liquidity environment covered in the macro-financing discussion of our budget analysis above.
Sector-specific realization timelines need to be planned for explicitly, not treated as a generic delay. A hydropower-heavy approval pipeline will structurally show a low same-year realization rate for years, by the nature of tranche-based project financing, and policy responses aimed at "improving realization" need to be calibrated to the specific sector mix of what has actually been approved, rather than applied as a single uniform target across fundamentally different investment types.
What this means for a business or investor actually operating in Nepal
If you are a foreign investor evaluating Nepal, treat the approval figure you read in the news as a ceiling on possibility, not a measure of actual capital flow, and build your own realistic timeline around the multi-year lag pattern described above, particularly if your project sits in a capital-intensive sector like hydropower or large-scale manufacturing. Our companion piece on FDI in Nepal: a practical guide for investors sets out the actual approval-to-registration sequence in detail; understanding the realization gap adds the macro context for why that sequence, done correctly and with realistic timing expectations, matters as much as it does.
If you are a Nepalese business seeking foreign investment, understand that the credibility of your own project's timeline and capital plan is being assessed against this exact backdrop. A foreign investor evaluating your business already knows, or should know, that approval alone means little; a well-documented, realistic capital deployment schedule, rather than an optimistic headline investment figure, is what will actually differentiate your project's credibility in that investor's own diligence process.
If you are reading Nepal's economic news generally, the discipline worth adopting is simple: whenever an FDI approval figure is reported, ask what the corresponding realized figure has historically been for that sector, before drawing any conclusion about the health of Nepal's investment climate from the approval number alone.
How Veritas uses this data with clients
We build financial models and capital deployment schedules for both inbound investors and Nepalese businesses seeking investment that are explicit about the realistic timeline between approval and actual fund availability, rather than modelling against an optimistic best case. See our FDI services in Nepal for how this fits into an investment planning engagement.
Frequently asked
Is the approval-realization gap unique to Nepal among developing economies?
A gap between approved and realized FDI exists in most developing economies with a formal investment-approval regime, since the structural causes, investor discretion after approval, project-specific realization timelines, are not unique to Nepal; what is worth tracking specifically for Nepal is the size and trend of its own gap over time, which is what the NRB data above actually shows.
Does a low realization rate mean Nepal's investment climate is deteriorating?
Not on its own. The realization rate reflects both the investment climate and the composition of what has been approved, since a year with several large, capital-intensive hydropower approvals will structurally show a lower same-year realization rate than a year dominated by smaller, faster-deploying projects, regardless of any change in the underlying investment climate. The multi-year inflow trend, and the sector composition of what is arriving, are more reliable indicators than any single year's realization percentage in isolation.
Sources
Nepal Rastra Bank: Foreign Direct Investment (FDI) in Nepal 2024/25
English Nepalnews: Nepal's FDI, Rs 340 billion stock, just Rs 7.3 billion in net inflows
Rising Nepal Daily: FDI inflows fall by two-thirds
World Bank: FDI net inflows (% of GDP), Nepal