
Service
Excel and Google Sheets dashboards in Nepal
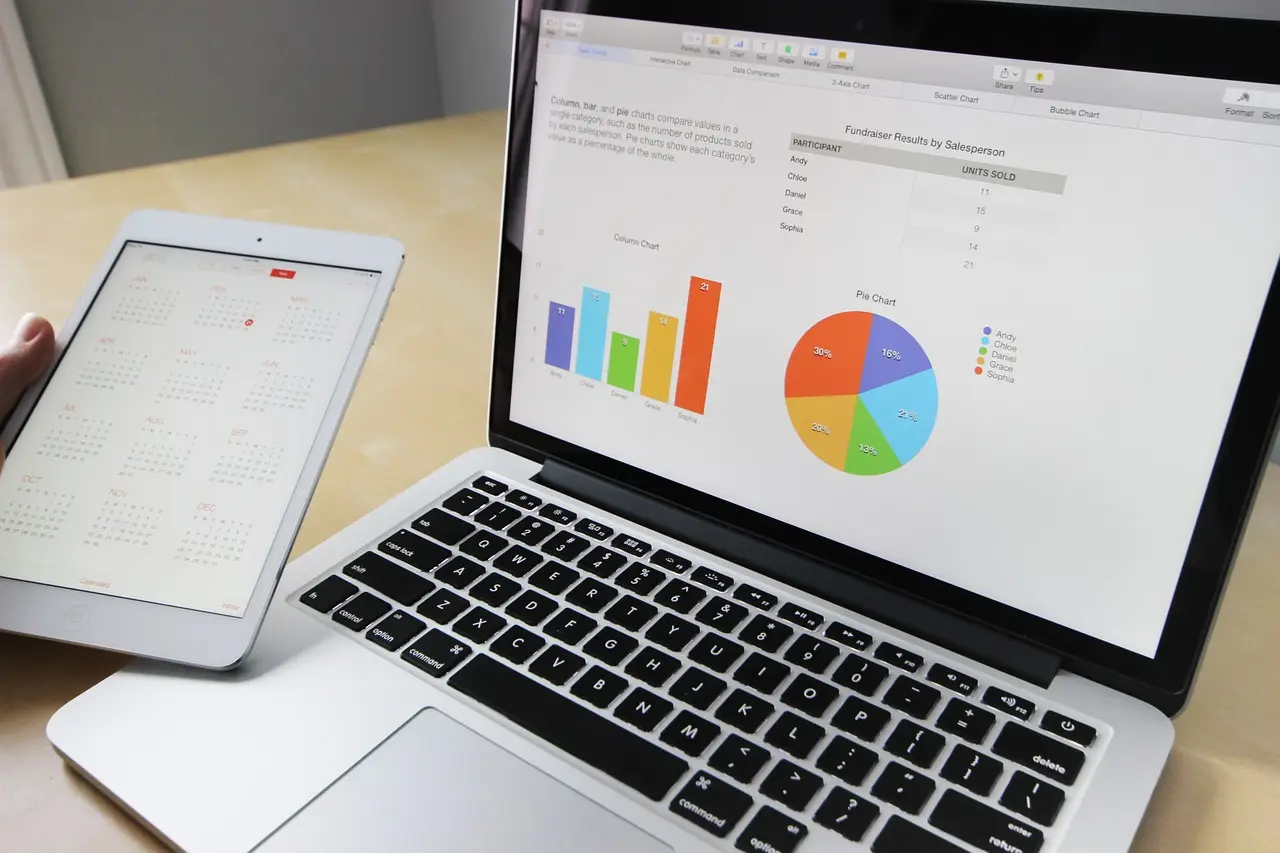
You do not need an expensive business-intelligence platform to see your business clearly. A well-built dashboard in Excel or Google Sheets can show sales, cash, receivables and profit on one screen and update when the data does. We design and build them, then teach your team to keep them running.
Who this is for
- Owners who want one view of the business instead of five reports
- Teams that already work in Excel or Google Sheets and want to keep doing so
- Businesses with several branches or product lines that need side-by-side comparison
- Managers who need a weekly or daily view, not a monthly one
What it includes
- 01
Dashboard design
A layout built around the decisions each person makes, with the few numbers that matter first.
- 02
Live data connection
Dashboards fed from your data files, exports or sheets, so they refresh without retyping.
- 03
Sales and profit views
Sales by product, branch, customer and period, with margin alongside revenue.
- 04
Cash and receivables views
Bank balance, aged receivables and payables, and expected cash for the coming weeks.
- 05
Charts and alerts
Clear charts, and flags that show when a figure crosses a threshold you set.
- 06
Documentation and training
A short guide and a working session, so your team can update and extend the file.
How it works
- 01
Agree the view
Who uses the dashboard, what they decide with it, and how often.
- 02
Prepare the data
Source data cleaned and structured so it can refresh reliably.
- 03
Build
The dashboard built and tested against your own figures.
- 04
Train and hand over
Your team learns to refresh and maintain it.
What we need from you
Having these ready shortens the first meeting. Share documents only once an engagement is agreed.
- Sample data. A recent export of the sales, stock or accounting data the dashboard will show.
- The key numbers. The five to ten figures you look at most often.
- The users. Who will look at it, and on what device.
- Current reports. Any report or sheet you use today, so we can build on it.
How we price this work
There is no standard price list, because the fee follows the scope and the depth of the work. We agree both in writing before anything starts.
- ScopeWhat is included, and what is not, set out in plain terms.
- Volume and condition of recordsClean, current books cost less to work from than a backlog.
- Depth and complexityA review is different from a full defence, filing or build.
- DeadlineWork against a fixed date, such as a reply to the IRD, is planned around it.
One-off work is quoted as a fixed fee for a defined scope. Ongoing work is a monthly retainer. The first 30-minute call is free, and you leave it with an indication of the cost and the time involved, even if you decide not to hire us. Book a free call.
Questions people ask
Excel or Google Sheets?
Excel suits larger data and complex calculations. Google Sheets suits teams that need shared, live access from anywhere. We recommend one after seeing your data and how your team works.
Will it update automatically?
Where the data source allows, yes. Otherwise the refresh is a short, documented routine, such as pasting a new export.
Can we keep using Tally?
Yes. Tally exports feed the dashboard, so the accounting system does not change.
How long does it take?
A first dashboard is often ready in one to three weeks, depending on how clean the data is.