
Nepal's total gross fixed capital formation, the standard measure of investment in an economy, stood at 24.33% of GDP in 2024, with the private sector contributing roughly 15.56% of GDP on its own. (World Bank, Gross Fixed Capital Formation, Nepal) The debate over whether Nepal needs more public investment or more private investment is, on the numbers, a smaller problem than a more basic one: the public investment Nepal has already budgeted is routinely not spent at all.
The investment split, in numbers
| Measure | % of GDP |
|---|---|
| Total gross fixed capital formation (2024) | 24.33% |
| Private sector gross fixed capital formation (latest available year) | 15.56% |
| Implied public and other investment (indicative only, as the years differ) | ~8.8% |
(World Bank, Gross Fixed Capital Formation, Private Sector)
Private investment already does the majority of the work in Nepal's capital formation. The public share, roughly a third of the total, is where the more urgent problem sits, not in how much is allocated, but in how much of what is allocated is ever actually spent.
The real constraint: execution, not allocation
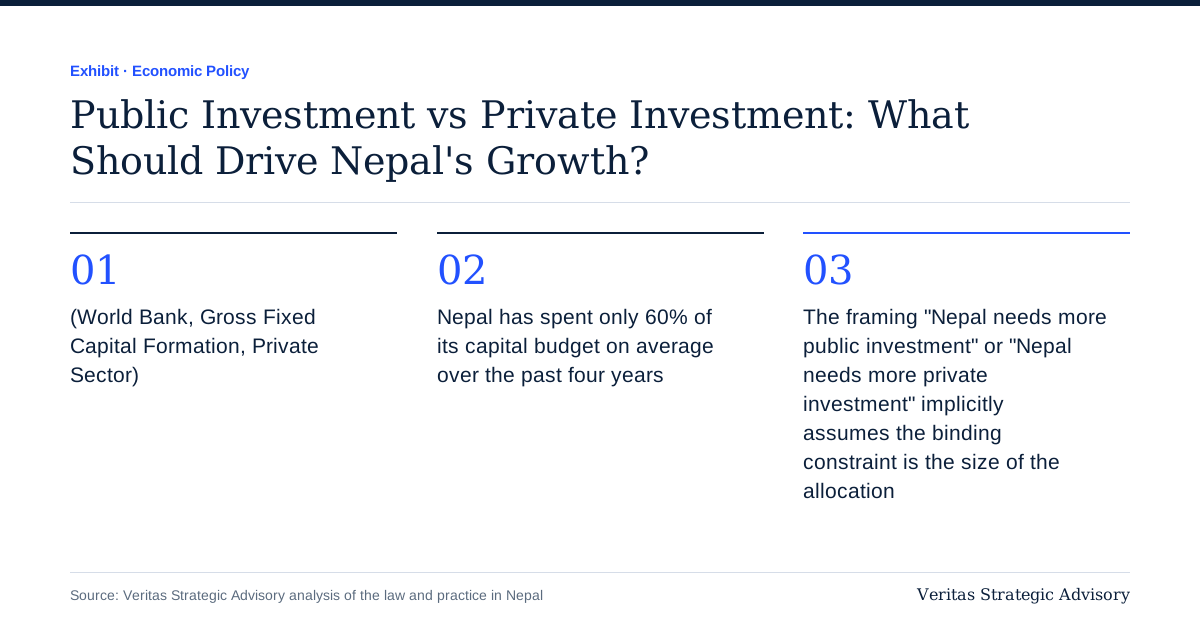
Nepal has spent only 60% of its capital budget on average over the past four years. In FY 2080/81, 63.20% of the allocated NPR 352.35 billion capital budget was spent. The gap has been "fairly constant at around 30% of the estimated budget amount" for roughly two to three decades. Most recently, capital expenditure for FY 2083/84 opened at just 1.78% of the annual target in the first two months of the fiscal year. (Economic Affair, Nepal Capital Expenditure Crashes; The Annapurna Express, Only 11.58 percent utilized in five months)
| Fiscal year | Capital budget execution |
|---|---|
| Past 4-year average | ~60% |
| FY 2080/81 | 63.20% |
| FY 2083/84 (first 2 months) | 1.78% of annual target |
This is structurally the same pattern documented in our companion piece on FDI approval is not the same as FDI realization: a headline figure, an approved investment amount or an allocated capital budget, and the amount that actually materialises as spent or invested capital, are consistently different numbers in Nepal, across both public and foreign investment. The commonly cited causes are consistent across studies: weak project readiness at the point of budget approval, delayed procurement processes, disruptive staff transfers mid-project, and slow disbursement of funds down to local and provincial governments actually responsible for delivery. (Economic Affair, Nepal capital expenditure analysis)
How this compares regionally
Nepal's total investment rate is not unusually low by regional standards on the allocation side alone: Bangladesh runs a notably higher gross fixed capital formation rate, at approximately 31–32% of GDP against Nepal's 24.33%. (Trading Economics, Nepal Gross Fixed Capital Formation) That roughly seven-to-eight-percentage-point gap against Bangladesh is meaningful, but it is considerably smaller than the execution gap Nepal has on its own public capital budget: a 30-to-40-percentage-point shortfall between what is allocated and what is spent, year after year, is a larger, more controllable problem than the total-allocation gap against a regional comparator.
| Country | Gross fixed capital formation, % of GDP |
|---|---|
| Bangladesh | ~31–32% |
| Nepal | 24.33% |
This ordering of priorities matters for where reform energy should actually go. Closing a seven-point gap against Bangladesh requires mobilising meaningfully more savings and capital into investment economy-wide, a slow, structural undertaking. Closing Nepal's own execution gap on the capital budget it has already allocated is a narrower, more tractable problem: project readiness, procurement timelines, and intergovernmental fund flow are process and institutional issues, not a shortage of capital waiting to be found. The more immediate, higher-return reform for Nepal is fixing execution on what is already budgeted, not chasing a larger allocation first.
Why this matters more than the public-vs-private debate itself
The framing "Nepal needs more public investment" or "Nepal needs more private investment" implicitly assumes the binding constraint is the size of the allocation. The execution data says otherwise: increasing the capital budget allocation without fixing the roughly 30-to-40% execution gap simply produces a larger unspent balance, not more roads, transmission lines, or industrial infrastructure on the ground. This is the core of the "better investment, not just more investment" argument: project readiness, procurement speed, and intergovernmental fund flow are the actual bottlenecks, and they do not improve automatically just because the headline allocation grows year over year, as it has in the FY 2083/84 budget covered in our companion piece on what the 2083/84 budget actually means for businesses.
The crowding-in effect Nepal is not yet capturing
In economies where public capital spending executes reliably, infrastructure investment, roads, power, industrial zones, typically "crowds in" private investment by reducing the cost and risk of a private project that depends on that infrastructure. A hydropower project needs transmission infrastructure; a manufacturing zone needs reliable power and road access; an agro-processing facility needs cold-chain logistics. When the public side of that equation executes at only 60% of plan, and in some periods barely off the ground at all, the private investment that would have been crowded in by completed infrastructure is delayed by the same margin, or does not materialise at all. This is a specific, mechanical link between the execution problem above and Nepal's broader private investment climate, not a separate issue.
What this means for a business planning around public infrastructure
If your investment case depends on a specific piece of public infrastructure being delivered on a stated timeline, treat the announced completion date as an optimistic upper bound, not a planning baseline, and build a realistic contingency into your own project timeline given the historical 60% execution average. A business that commits capital assuming on-schedule public delivery, in a country where a fifth consecutive year of roughly 60% execution is the norm rather than the exception, is taking on a risk that is measurable and should be priced into the decision, not treated as unforeseeable.
If you are evaluating whether a sector is genuinely being "unlocked" by a stated public investment commitment, check the execution track record for that specific ministry or agency's past capital spending, not just the current year's allocation, since the allocation-to-execution gap varies meaningfully across different parts of government.
If you are a business in a position to advocate for reform, through a chamber, an industry association, or direct engagement, the evidence-based ask is not "increase the capital budget," it is "fix project readiness and procurement timelines so the existing budget actually gets spent," a materially different and more achievable request.
How Veritas factors this into client advisory
Where a client's investment case depends on public infrastructure delivery, we build the realistic execution-adjusted timeline into the financial model explicitly, rather than modelling against the announced completion date, and stress-test the investment case against the historical execution range shown above. See our financial advisory and modelling service for how this is applied to a specific project.
Frequently asked
Is Nepal's capital execution problem improving over time?
The data shows the gap has remained fairly constant at around 30% of the estimated budget for two to three decades, which means there is no strong recent trend toward improvement to rely on; each year's execution rate should be checked against the actual reported figures as they are released, not assumed to be better than the historical average.
Does a low execution rate mean the allocated capital budget increase in a given year is meaningless?
Not meaningless, but its practical effect depends entirely on whether execution capacity improves alongside the allocation. A larger allocation with the same 60% execution rate produces a proportionally larger absolute amount of infrastructure delivered, even if the percentage gap does not close, so the increase still matters, just less than the headline percentage increase alone would suggest.
Sources
World Bank: Gross Fixed Capital Formation (% of GDP), Nepal
World Bank: Gross Fixed Capital Formation, Private Sector (% of GDP), Nepal
Economic Affair: Nepal Capital Expenditure Crashes to Just 1.78% in First 2 Months
The Annapurna Express: Only 11.58 percent of capital budget utilized in five months
Trading Economics: Nepal Gross Fixed Capital Formation (% of GDP)