
- of clean monthly history is a practical minimum for a seasonal sales model
- 3 years
- is the horizon of the cash forecast most Nepali companies need first
- 13 weeks
- scenarios with triggers are worth more than one precise number
- 2 to 3
Every business in Nepal forecasts. The distributor deciding how much to order before Dashain is forecasting. The hotelier setting rates for the spring season is forecasting. The finance head who tells the bank that the overdraft will be regularised by Falgun is forecasting. Most of it is done in the owner's head, informed by years of experience, and much of it is good.
The claim made for artificial intelligence is that a machine can do this better. Sometimes it can, decisively. Sometimes it cannot, and a company that trusts the machine at the wrong moment will be worse off than one that never bought it. The skill lies in knowing which situation you are in.
This is the eighth article in our series on artificial intelligence for business in Nepal, and the third on finance, after the CFO's office in 2030 and redesigning the close.
What the evidence says
Research on forecasting is unusually mature, and three findings from decades of empirical work, including the long-running M forecasting competitions, are worth knowing.
Simple statistical methods are hard to beat. For many business series, a method as plain as "the same month last year, adjusted for recent trend" performs close to far more elaborate models. Complexity earns its keep only with large volumes of data and many related series.
Combinations beat individual forecasts. Averaging several methods, or a model with informed judgement, is more accurate on average than any single one. This is among the most robust findings in the field.
People adjust too often and too optimistically. Studies of judgemental adjustments to statistical forecasts find that large adjustments made for a specific, known reason tend to improve accuracy, while frequent small adjustments tend to make it worse, and that adjustments lean upward.
Modern machine learning has added real capability at scale: retailers forecasting millions of item-store combinations, lenders estimating default, utilities forecasting load. The most recent M competitions were won by machine learning methods on exactly that kind of large, hierarchical data. For a company with forty products and five years of monthly history, the older lessons still hold.
Where do the large consulting firms stand? Their surveys record forecasting among the growing uses of AI in finance and supply chain, and their case material reports material reductions in forecast error and inventory. Those results are real for the companies concerned. They also come overwhelmingly from large enterprises with deep data, and the firms themselves stress that data and process readiness decide the outcome.
Where machines win
A model is likely to beat unaided judgement when four conditions hold.
The decision is frequent. Hundreds or thousands of forecasts, so that being slightly better on average accumulates.
History is long and clean. At least two to three years, recorded consistently, at the level being forecast.
The pattern is stable. Seasonality, trend, day-of-week and festival effects that recur.
Feedback is fast. The outcome is known quickly, so the model can be checked and corrected.
Typical cases in a Nepali business:
| Forecast | Why a model does well |
|---|---|
| Weekly sales by product and depot for a distributor | Many series, strong seasonality, fast feedback |
| Stock replenishment quantities | Repeated decision, cost of error measurable |
| Collections from the receivables ledger | Customer payment habits are stable and recorded |
| Hospital outpatient volumes by day | Calendar-driven patterns |
| Call volumes, transaction counts, footfall | High frequency |
| Electricity generation for run-of-river hydropower | Hydrology is seasonal, long records exist |
| Routine expense lines: payroll, rent, utilities | Contractual or stable |
| Probability that an invoice will be paid late | Many past invoices to learn from |
In these cases the human forecaster's known weaknesses are costly: anchoring on last month, over-reacting to the most recent event, optimism about favoured products, and inconsistency from one week to the next. A model has none of those. It also does not get tired at the three-hundredth item.
Where judgement wins
A model knows only what its history contains. It fails, often silently, when the future differs from the past in a way the data cannot show.
Structural breaks. Nepal has had many: the 2015 earthquake and the blockade that followed, the pandemic, the import restrictions and liquidity squeeze of 2022, the disruption of September 2025. No model trained on the preceding years would have forecast any of them, and for months afterwards its output was worse than useless.
Policy changes. A budget that alters customs duty or VAT treatment. A Nepal Rastra Bank directive on loan-to-value ratios, working capital limits or margin lending. A change in the IT export tax concession. These move demand and cost by step, on a known date, and they are known to people before they are known to data (what the 2083/84 budget means for businesses).
One-off events. A large tender. A new competitor. A key customer in difficulty. A road closed for a season. A strike.
New things. A new product, branch or market has no history. Analogy and judgement are all there is.
Small data. A company with eighteen months of records, or one whose records changed basis when it changed software, cannot support a model.
Strategic questions. Should we enter this market? Will this investment pay? These are not forecasts in the statistical sense. They are judgements about a future the company itself will shape.
Reflexive situations. If everyone uses similar models and acts on them, the pattern changes. Share markets are the obvious case, which is one reason to be wary of anyone selling AI predictions of the NEPSE index.
Nepal's sources of uncertainty
A forecasting approach for a Nepali business should name the particular things that move its numbers.
| Driver | How it shows up | Can a model capture it? |
|---|---|---|
| Festival calendar | Demand peaks around Dashain, Tihar, Teej, New Year and wedding seasons, on dates that shift each Gregorian year | Yes, if the model uses the Bikram Sambat calendar and festival flags |
| Monsoon | Construction slows, agriculture and hydropower peak, roads close | Largely yes, as seasonality. Year-to-year severity, no |
| Remittance inflows | Drive household consumption and bank liquidity | Partly, using published NRB monthly data as an input |
| Interest rates and liquidity | Cost and availability of credit swing between tight and loose | As a scenario input, not a prediction |
| Government capital spending | Concentrated in the last quarter (Ashadh) | Yes, as a pattern. The amount, no |
| The Indian rupee peg and Indian policy | Import prices, export bans on food items, border procedures | Scenario only |
| Tourism arrivals | Seasonal, and sensitive to events and air connectivity | Seasonality yes. Shocks no |
| Policy and tax changes | Step changes on budget day and by directive | Judgement |
| Political events | Strikes, government changes, unrest | Judgement and scenario |
| Fiscal year end | Sales pushes, collections drives, tax-driven timing in Ashadh | Yes, as a pattern |
Two practical points follow. First, any model must work on the Bikram Sambat calendar or carry festival dates explicitly: Dashain falls in different Gregorian weeks each year, and a model that compares October with October will be wrong every year. Second, the last column shows how much of what matters is scenario and judgement. In an economy this exposed to shocks, the point forecast deserves less attention than the range.
The division of labour
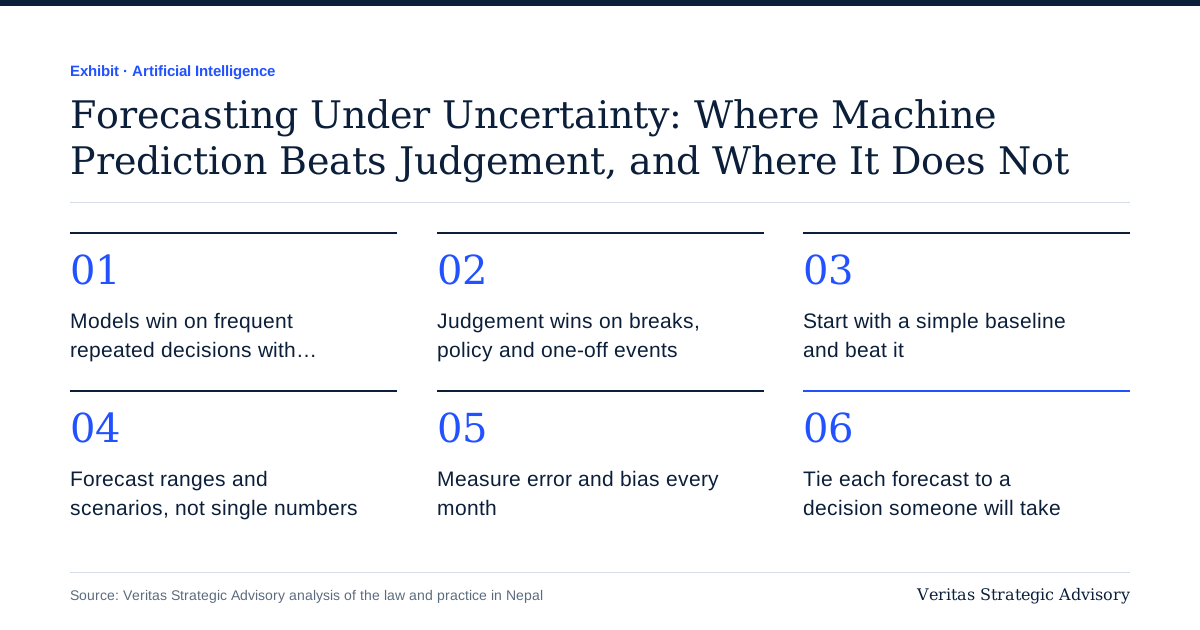
The question is never machine or human. It is which does what.
Step 1: a statistical baseline. For each recurring forecast, produce a baseline by a simple, transparent method. Seasonal naive, moving average or exponential smoothing in a spreadsheet is enough to begin. This is the benchmark everything else must beat.
Step 2: adjust by exception, with reasons. People may change the baseline only for a stated, specific reason the history cannot contain: a confirmed order, a price change, a new outlet, a policy change. Record the adjustment and the reason. Small tweaks "because it feels low" are not allowed.
Step 3: scenarios for the breaks. For the handful of uncertainties that would change decisions, build two or three scenarios with explicit assumptions.
Step 4: measure both. Each month, compare the baseline and the adjusted forecast with the outcome. If adjustments are not adding accuracy, stop making them. If the baseline is failing, find out what changed.
This arrangement uses the machine for consistency and the person for information. It also produces, over a year, evidence about whose judgement adds value, which is more useful than any debate.
A ladder of methods
Climb only as far as the decision justifies.
| Rung | Method | Needs | Suits |
|---|---|---|---|
| 1 | Same period last year, adjusted for growth | One to two years of data, a spreadsheet | Any company starting out |
| 2 | Moving averages and exponential smoothing with seasonality | Two to three years monthly, a spreadsheet | Most mid-sized companies |
| 3 | Driver-based model: volume, price, mix, capacity, conversion | Understanding of the business, clean operational data | Budgeting, planning, lender projections |
| 4 | Regression with external drivers: remittances, arrivals, rainfall, rates | Longer history, some statistical skill | Larger companies, sector-specific uses |
| 5 | Machine learning across many series | Thousands of series, clean granular data, specialist skill or a vendor product | Large distributors, retailers, banks, telecoms |
Most Nepali mid-sized companies are on rung 1 or below. Moving to rung 2 or 3 captures the larger part of the available gain. Rung 5 is appropriate for few, and is usually bought as a feature of an inventory, planning or banking system instead of built (build, buy or wait).
Generative AI tools deserve a specific note. A large language model is not a forecasting engine. Asked to predict next quarter's sales from a pasted table, it will produce a confident, fluent answer by a method you cannot inspect. Its legitimate uses in forecasting are different: writing the formulas or code for a statistical model, explaining a method, summarising what drove a variance, and drafting the narrative. Let it help build the model. Do not let it be the model.
The first forecast to build: thirteen weeks of cash
If a company builds one forecast, it should be a rolling thirteen-week cash flow. It addresses the commonest way that profitable Nepali businesses get into trouble (profitable but short of cash), and most of its inputs are known, not predicted.
Receipts. Start from the receivables ledger. For each customer, apply their actual historical payment delay, not the credit term on the invoice. Add forecast sales for later weeks, lagged by the same habits. This is where a model helps: customer payment behaviour is stable and learnable.
Payments. Payables by due date, adjusted for the company's actual payment practice. Payroll on its dates. Rent. Loan instalments and interest from the bank schedules. LC retirements and import duties from the shipment schedule.
Tax. VAT on the 25th. TDS within 25 days of month end. Advance income tax at the end of Poush, Chaitra and Ashadh. SSF and CIT deposits. These are certain in timing and estimable in amount, and they are the items most often forgotten.
One-offs. Capital expenditure, dividends, bonus, festival advances, insurance renewals.
Position. Opening balance, net movement, closing balance against the overdraft limit, week by week.
Update it every week with actuals, roll it forward one week, and record the variance. Within three months the company will know how reliable each line is. Our cash flow calculator gives a simplified starting view, and how much working capital a business needs covers the underlying arithmetic.
Ranges and scenarios
A single number invites false confidence. Two habits correct it.
Forecast in ranges. State a central estimate with a low and high case, set from the forecast's own track record. If monthly sales forecasts have missed by 12 per cent on average, the honest statement is "NPR 4.0 crore, likely between 3.5 and 4.5". Decisions about stock, staffing and borrowing should be tested against the low end.
Build scenarios around named uncertainties. For a trading company in the current year these might be:
| Scenario | Assumption | Effect to model |
|---|---|---|
| Base | Conditions as now | Baseline forecast |
| Credit tightens | Lending rates up 2 percentage points, banks reduce limits | Interest cost, customers pay slower, sales soften |
| Supply disruption | Border or road disruption for four weeks | Stock-outs, lost sales, later catch-up, higher freight |
| Demand shock | A festival season 15 per cent below last year | Excess stock, cash tied up, discounting |
For each, decide in advance the trigger that says the scenario is occurring and the action that follows. A scenario without a trigger and an action is an essay.
Lenders think this way. A projection submitted with a loan application is far more persuasive with a downside case and a debt service calculation under it (what to calculate before taking a bank loan).
Measuring a forecast
Few companies measure forecast accuracy at all. Three measures are enough.
Error. The average absolute percentage difference between forecast and actual. Tells you how wrong, on average.
Bias. The average signed difference. Tells you whether you are consistently high or low. Sales forecasts are usually biased high and cost forecasts low.
Value added. The error of the final forecast against the error of the naive baseline. If the elaborate process does not beat "same as last year plus growth", it is not earning its cost.
Review these monthly, by forecaster where there are several. Treat a forecast miss as information, not as a failing to be punished: when misses are punished, people forecast low and the numbers become useless. Keep the forecast separate from the target. A target is what the company wants. A forecast is what it expects. Confusing the two is the commonest reason forecasts are wrong.
Common mistakes
Buying a forecasting tool before there are three years of consistent history.
Forecasting at a level of detail nobody acts on.
Using Gregorian months for a business that moves with the Bikram Sambat calendar.
Treating a model's output as fact because it has decimals.
Leaving a model running after a structural break.
Adjusting every figure by a little.
Forecasting profit and not cash.
Never comparing forecast with outcome.
Presenting a single optimistic case to the bank.
From ground level to policy level
At ground level, the forecaster's raw material is the company's own record: sales by item and day, stock, collections. If those records are thin, no method will help, and the first project is recording.
At company level, forecasting is a management process: who produces it, who may change it, which decisions it drives, and how its accuracy is reviewed. The board's interest is in the scenarios and the company's resilience under them.
At sector and national level, Nepal's public data is improving but still limits what models can do. Nepal Rastra Bank publishes monthly macroeconomic and financial data, including remittances, credit, deposits and trade. The National Statistics Office publishes national accounts and prices, and the Nepal Tourism Board and immigration authorities publish arrivals. Much else that a business forecaster would want, such as timely sector output, regional consumption or reliable price series by commodity, is sparse or late. The National AI Policy 2082 speaks of national datasets and open data. For business forecasting, timely and granular public statistics would be among the most valuable things the state could provide.
Lenders and regulators are themselves forecasting more formally. Banks apply expected credit loss models under NFRS 9, which require forward-looking estimates, and stress testing is part of supervision. A borrower whose own forecasts are disciplined speaks the same language.
The role of consulting and advisory firms
The large consulting firms have substantial practices in forecasting and planning: demand forecasting for consumer goods and retail, integrated business planning, treasury and cash forecasting, and scenario analysis. They publish useful material on combining statistical forecasts with planner judgement and on organising planning. The major accounting firms build forecasting and expected credit loss models for banks and review the models others build.
A mid-sized company should take two lessons from that body of work and leave the rest. The first is that process and accountability matter more than the algorithm. The second is that forecast accuracy should be measured. The elaborate platforms are for companies with thousands of series.
Beware two offers. One is the vendor who promises accuracy percentages before seeing your data. The other is the financial projection prepared for a bank or investor with no link to how the business is run. A projection is useful when the company can explain every driver and updates it as results come in.
Our own role is at the practical end. We build driver-based financial models and thirteen-week cash forecasts (financial advisory and modelling), prepare projections for lenders (bank loan documentation), and maintain rolling forecasts as part of virtual CFO work. We use statistical methods suited to the size of the data, and we say when the data does not support a model. We do not sell forecasting software or predictions of markets.
The next 90 days
Days 1 to 30. List the forecasts the business makes and the decision each one drives. Pick two: cash for thirteen weeks, and sales for the main product groups. Gather three years of history on the Bikram Sambat calendar. Build a naive baseline for each.
Days 31 to 60. Run the cash forecast weekly and compare with actuals. Add a seasonal method for sales. Introduce the rule that adjustments need a recorded reason. Define two downside scenarios with triggers.
Days 61 to 90. Calculate error and bias for both forecasts. Decide whether adjustments are helping. Present the board with the base case, the range and the scenarios. Link stock ordering and the borrowing plan to the forecast.
Frequently asked questions
Can AI predict my sales?
For established products with a few years of clean history, a statistical or machine model will usually give a better baseline than intuition. It will not anticipate a new competitor, a policy change or a disruption. Use it as the starting point and adjust for what you know.
How much data do we need?
For monthly seasonal forecasting, three years is a practical minimum and five is better. For weekly or daily forecasts, two years can be enough. Data must be recorded on a consistent basis.
Should we buy forecasting software?
Not first. Build a baseline in a spreadsheet and measure it. If the business has hundreds of items and the baseline is clearly inadequate, look at the forecasting features of inventory or planning systems.
Can we use ChatGPT or a similar tool to forecast?
Use it to help build a model, write formulas and explain methods. Do not rely on a number it produces directly from pasted data. It is a language model, not a statistical one, and its method is not visible.
How do we forecast after a shock?
Set the model aside for a time. Use scenarios, short horizons and weekly updates. Return to statistical methods once a few months of post-shock data exist, and decide whether to exclude or flag the shock period.
What accuracy should we expect?
It depends on the level. Total monthly sales may be forecast within 5 to 10 per cent. Individual items will be much less accurate. What matters is whether the forecast beats the naive baseline and whether its error is known.
Who should own the forecast?
Finance should own the process and the measurement. Sales and operations supply the information. The owner or managing director decides between scenarios.
Is a budget a forecast?
No. A budget is a plan and a set of targets fixed once a year. A forecast is a current expectation, updated as events unfold. A company needs both and should not let the budget stand in for the forecast.
*This article is general guidance, not professional advice. Examples and thresholds are illustrative. Forecasts are uncertain by nature and should not be relied on as predictions of results.*