
- of organisations in McKinsey's 2025 survey report any profit effect from AI
- 39%
- of companies in BCG's 2025 study report no material value from AI spending
- 60%
- places the money actually sits in a Nepali mid-sized company
- 4
The most quoted number in the AI debate is McKinsey's 2023 estimate that generative AI could add USD 2.6 trillion to 4.4 trillion a year to the world economy. It is a serious piece of work and it tells a managing director in Biratnagar almost nothing. A global total says where the value could be if every company executed well. It does not say what one distributor, one hospital or one manufacturer in Nepal can bank next year.
The evidence on what companies actually bank is sobering. In McKinsey's 2025 survey only 39 per cent of organisations reported any effect of AI on enterprise operating profit, and most of those put it under 5 per cent. BCG found that 60 per cent of companies were getting no material value. The gap between potential and result is the subject of this article. We set out where the money is in a Nepali company, how to size it honestly, and how to tell a real gain from a comfortable story.
This is the second article in our series on artificial intelligence for business in Nepal. It follows the questions a board should ask.
Why the global arithmetic does not transfer
Most published business cases for AI are built on labour substitution in a high-wage economy. A customer service agent in the United States costs the employer several thousand dollars a month. A tool that handles a third of the calls pays for itself many times over. The same logic drives the estimates for software engineering, marketing and back-office work.
Run that arithmetic in Nepal and it collapses. An accounts assistant in Kathmandu may cost the company NPR 35,000 to 60,000 a month all in. A capable AI subscription is priced in dollars at broadly the same amount everywhere, typically a few thousand rupees per user per month at recent exchange rates, and specialist finance automation costs far more. A tool that saves 30 per cent of an assistant's time saves perhaps NPR 12,000 to 18,000 a month of salary, and only if the saving is turned into one fewer hire. The ratio of labour saved to software cost is five to ten times less favourable than in a rich economy.
Two other features of the Nepali economy push the other way, and they are where the value is.
Money is expensive. Working capital is financed at bank lending rates that have ranged widely in recent years, often around or above 10 per cent. Every crore tied up in stock or receivables costs roughly ten lakh a year in interest, and for a company near its borrowing limit it costs more than interest: it costs the next order. A tool that cuts receivable days or stock days therefore earns far more in Nepal than the same tool in an economy where money costs 4 per cent.
Leakage is high. Mid-sized companies here run on thin management information. Discounts are given informally, landed costs are discovered after the price is set, stock is counted rarely, and tax mismatches surface in an assessment years later. Where there is little measurement there is a lot to find, and finding patterns in transaction data is what analytical tools do well.
So the Nepali business case is a capital and control case, not a labour case. A board that expects savings in salaries will be disappointed. A board that looks at cash, margin and penalties will find something worth having.
The four places the money sits
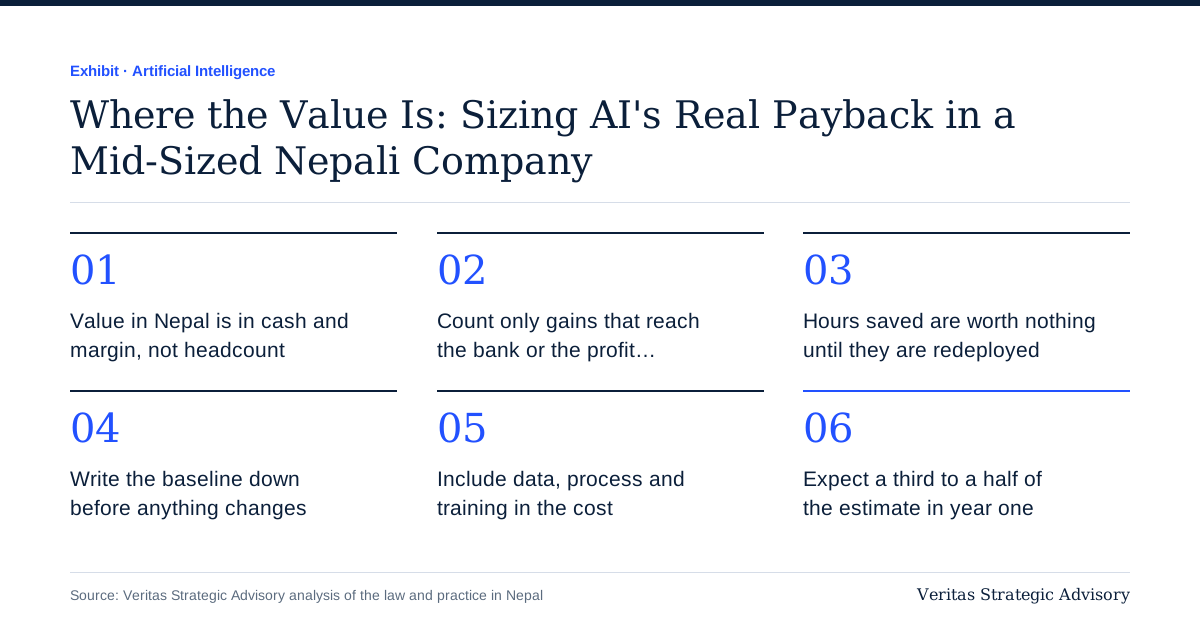
Every claimed benefit should be forced into one of four categories. If it fits none of them, it is not a financial benefit, however real the convenience.
1. Working capital released. Fewer days of receivables, fewer days of inventory, better use of supplier credit. The value is the cash released multiplied by the cost of money, plus, for a constrained company, the margin on sales that the freed cash makes possible. See how much working capital your business needs.
2. Margin leakage stopped. Unauthorised discounts, under-recovered freight, pricing below landed cost, duplicate payments, pharmacy and store shrinkage, unbilled services. The value is the leakage rate multiplied by the base it applies to, less what it costs to enforce.
3. Sales not lost. Stock-outs in fast-moving lines, quotations sent late, customers who lapse without anyone noticing, rooms sold too cheaply in peak season. The value is the extra revenue multiplied by the contribution margin, not the revenue itself.
4. Losses and penalties avoided. Tax assessments from mismatched filings, interest on late TDS deposits, fraud, bad debts. The value is the probability of the loss multiplied by its size. This is the hardest to prove and often the largest.
Notice what is missing: "productivity". Time saved is an input to the four categories, not a category of its own. Ten hours a week saved in the accounts team is worth something only when it becomes a faster close that improves a decision, a hire that is not made, or a reconciliation that now gets done and catches an error. The board should ask, for every hour claimed, where it goes.
A value map by function
Research on where AI pays tends to agree on the functions. McKinsey's 2023 study put about three quarters of the potential value of generative AI in four areas: customer operations, marketing and sales, software engineering and research and development. Gartner's November 2025 survey of finance functions found the most common uses to be knowledge management (49 per cent), accounts payable automation (37 per cent) and error and anomaly detection (34 per cent).
Translated for a mid-sized Nepali company, the map looks like this.
| Function | Use that tends to pay | Category of gain | What it depends on |
|---|---|---|---|
| Receivables | Ranking customers by likelihood of delay, drafting reminders, flagging disputes | Working capital, bad debt avoided | Clean customer master, invoice and receipt dates |
| Inventory and purchasing | Demand forecasts for fast lines, reorder suggestions, slow-stock alerts | Working capital, sales not lost | Item master, daily sales by item, lead times |
| Pricing and discounts | Finding sales below landed cost, discount patterns by salesperson | Margin leakage | Landed cost per item, discount recorded on the invoice |
| Payables | Invoice capture, duplicate detection, three-way matching | Leakage, some time | Purchase orders in the system, vendor master with PAN |
| Tax compliance | Matching VAT returns to books, purchase register to suppliers' filings, TDS to ledger | Penalties avoided | Monthly close, access to portal data |
| Reporting | Drafting variance commentary, answering questions from the ledger | Decision speed | A reliable close and chart of accounts |
| Sales and service | Lead follow-up, answering routine queries in Nepali and English | Sales not lost | A record of enquiries and outcomes |
| People | Screening applications, drafting letters, answering policy questions | Time | Written policies |
Two observations follow. First, the highest-value rows are the ones that depend most on data the company must produce itself. Second, the row most companies start with, a public-facing chatbot, is among the lowest in value for a business whose customers buy by phone and relationship.
A worked example
The figures below are illustrative. They describe a hypothetical trading and distribution company, not a client, and each assumption can be replaced with a reader's own.
The company. Annual sales NPR 80 crore. Gross margin 12 per cent (NPR 9.6 crore). Operating profit about 4 per cent (NPR 3.2 crore). Receivables at 60 days of sales (about NPR 13.2 crore). Inventory at 45 days of cost of sales (about NPR 8.7 crore). A finance and accounts team of eight costing about NPR 53 lakh a year. Borrowing cost 10 per cent.
Use case A: invoice capture and bank reconciliation. Software reads purchase bills and matches bank lines to ledger entries. Assume it removes 30 per cent of the team's routine work. Notional saving: NPR 16 lakh. Bankable saving: one planned hire not made, about NPR 6.5 lakh a year. The rest of the time is real but only becomes money if it is redeployed, for example into the collections follow-up in use case B.
Use case B: collections prioritisation. Customers are ranked each week by amount and likelihood of delay, based on their own payment history, and the team calls in that order. Assume receivable days fall from 60 to 55. Cash released: NPR 80 crore divided by 365, times 5, about NPR 1.1 crore. Annual interest saved at 10 per cent: NPR 11 lakh. Assume bad debts fall by 0.1 per cent of sales: NPR 8 lakh. Total: about NPR 19 lakh a year.
Use case C: demand forecasting on the top 300 items. Assume inventory falls by four days: about NPR 77 lakh released, worth NPR 7.7 lakh a year in interest. Assume stock-outs fall enough to add 0.5 per cent to sales: NPR 40 lakh of revenue at 12 per cent margin, NPR 4.8 lakh. Total: about NPR 12.5 lakh.
Use case D: price and discount analytics. A monthly review of every invoice line against landed cost and the approved discount grid. Assume leakage of 0.2 per cent of sales is recovered: NPR 16 lakh.
Use case E: tax reconciliations. Monthly matching of the VAT return to the books, of input credit claims to supplier invoices, and of TDS deducted to TDS deposited. The gain is an avoided loss. Suppose there is a one in five chance each year of an assessment adjustment and charges of NPR 25 lakh arising from mismatches that the reconciliation would have caught. Expected value: NPR 5 lakh a year. The real value may be much higher, because one bad assessment can absorb months of management time.
Use case F: website chatbot. Enquiries come by phone and through the sales team. Expected gain: negligible.
| Use case | Category | Gross annual gain (NPR lakh) | Confidence |
|---|---|---|---|
| A. Invoice capture and bank reconciliation | Cost (one hire avoided) | 6.5 | High |
| B. Collections prioritisation | Working capital, bad debt | 19 | Medium |
| C. Demand forecasting | Working capital, sales | 12.5 | Medium |
| D. Price and discount analytics | Margin leakage | 16 | Medium |
| E. Tax reconciliations | Penalties avoided | 5 | Low to prove, high in consequence |
| F. Website chatbot | None | 0 | High |
| Total potential | 59 |
A potential of NPR 59 lakh is about 0.75 per cent of sales and roughly 18 per cent of operating profit. That is a large number for a thin-margin business, and it is a ceiling, not a forecast.
From potential to what you will bank
Three deductions turn the ceiling into a plan.
Deduct the full cost. The software is the small part. A realistic first-year cost for this company might look like this, again as an illustration.
| Cost item | First year (NPR lakh) | Later years (NPR lakh) |
|---|---|---|
| Software subscriptions and add-ons | 5 | 5 |
| Data clean-up: item, customer and vendor masters | 4 | 1 |
| Process redesign and set-up | 5 | 1 |
| Training and the dip in output while people learn | 2 | 0.5 |
| Management time | 3 | 1.5 |
| Total | 19 | 9 |
BCG's 10-20-70 rule describes the same thing from the other side: roughly 10 per cent of the effort in a successful programme goes on algorithms, 20 per cent on technology and data, and 70 per cent on people and processes. A budget that is 90 per cent licences has the proportions upside down.
Deduct for adoption. Gains arrive when people change what they do, and that takes two or three quarters. A collections ranking that the sales team ignores releases no cash. Assume a third to a half of the potential in the first year.
Deduct for overlap and optimism. Use cases B and D both depend on the sales team behaving differently. Use cases B and C both reduce borrowing, and the interest saved cannot be counted twice. Every estimate was made by someone who wanted the project approved.
On those terms the first year of our illustration yields perhaps NPR 20 to 30 lakh against a cost of NPR 19 lakh: roughly break-even, with a run-rate gain of NPR 40 to 50 lakh from the second year against NPR 9 lakh of running cost. That is a good investment by any standard. It is also a very different story from "AI will transform the business", and it needed no model built from scratch.
The shape of that curve, cost first and gain later, explains part of the disappointing survey results. Many companies measure in the trough and stop.
Measuring so that the board can believe it
The commonest reason a real gain is not believed is that nobody wrote down the starting point. Measurement needs four things, none of them technical.
A baseline. Before the change, record the measure for at least three months: receivable days by customer segment, stock days by category, close date, number of manual journal entries, discount rate by salesperson. Use the same definition after.
A comparison. Where possible, change one part of the business and not another. Run the collections ranking for the Kathmandu customers and not for the rest for one quarter. If receivable days fall in both, something else caused it: the season, a bank's lending rate, a festival.
Attribution in cash terms. Tie the measure to the bank and the ledger. If stock fell by NPR 77 lakh, the overdraft should be lower by a comparable amount, all else equal. If it is not, find out where the cash went.
An owner who is not the sponsor. The finance head, or an outside reviewer, should confirm the numbers, not the person who proposed the project.
Seasonality needs particular care in Nepal. Sales before Dashain and Tihar, the fiscal year end in mid-July, the monsoon and the tourist seasons all move working capital sharply. Compare with the same months of the previous year, not with the previous quarter.
Where the value is not
It saves money to be clear about what will not pay.
A model of your own. Training or heavily customising a model needs data volumes, skills and maintenance that a mid-sized company does not have. See build, buy or wait.
Automating a broken process. If purchase orders are raised after the goods arrive, automated matching will produce a list of exceptions as long as the list of invoices.
Forecasting without history. A demand forecast needs two or three years of clean daily sales by item. With less, a simple reorder rule does as well.
Customer-facing automation where trust is personal. In much of Nepali business the relationship is the product. A machine that answers a long-standing customer's query may cost more goodwill than it saves in time.
Anything where the error is expensive and nobody checks. Tax positions, legal drafting and financial statements can be drafted with help, but the value disappears with the first confident mistake that reaches the tax office or a bank (can AI be trusted on Nepali tax law).
How the picture differs by sector
The four categories apply everywhere, but the weights change.
In trading and distribution, working capital dominates, as in the example. In manufacturing, the value is in yield, energy, maintenance timing and costing accuracy, and it depends on production data that many plants do not yet record (manufacturing costing and inventory control). In hotels, it is rate setting by season and channel, where a few percentage points of average rate in peak months outweigh every back-office saving. In hospitals, it is pharmacy and consumables control, and claim rejections by insurers. In banks and financial institutions, it is credit assessment, early warning on loans and fraud detection, under Nepal Rastra Bank's guidelines. In IT and business process exporters, AI is both the largest opportunity and the main threat to the billing model, because the client can see how many hours the tools save.
We take the sectors one by one in AI across Nepal's sectors.
The policy and price environment
A few external factors bear on the arithmetic.
Exchange rate. Subscriptions are priced in dollars. A weaker rupee raises the cost without raising the benefit. Budget in dollars and review annually.
Payment and tax on imported software. Paying a foreign vendor raises withholding and VAT reverse-charge questions that should be settled before the subscription starts, not at the audit (TDS on foreign vendor payments).
Electricity and connectivity. Cloud tools need a stable connection. A process that stops when the line drops needs a manual fallback, and that fallback is part of the cost.
Public infrastructure. The 2083/84 budget announced a sovereign AI compute centre and subsidised compute for startups. This matters to firms that build AI products. It makes little difference to a company that consumes AI through ordinary software.
The tax office's own analytics. As the Inland Revenue Department moves to automated risk selection, the value of use case E rises every year. The cost of a mismatch is no longer the small chance that someone notices.
The role of consulting and advisory firms
The large consulting firms have done the most to frame AI as a question of value and not of technology, and their published methods are worth borrowing. The idea of a value pool by function comes from McKinsey's work. The finding that most of the effort lies in people and processes is BCG's. The surveys by KPMG, Deloitte and Gartner on finance functions show which uses are common enough to be safe choices.
Two cautions. The firms' samples are mostly large companies in high-wage economies, so the mix of benefits is weighted toward labour savings that do not transfer here. And a firm that sells implementation has an interest in the size of the estimate. The MIT study, which is more sceptical, noted that the best returns were often in unglamorous back-office work while budgets went disproportionately to sales and marketing.
For a mid-sized company in Nepal, the useful contribution of an adviser to this particular question is narrow and concrete:
building the baseline from the company's own ledgers, which most companies have never done;
sizing each use case in the four categories, with assumptions written down;
challenging the estimate, including by saying which use cases to drop;
confirming the result after six and twelve months against the bank and the books.
An adviser paid on a share of claimed savings has an obvious conflict. One paid a fixed fee to tell the truth does not. Our own work in this area is the finance side of it: management reporting and analytics, financial modelling, working capital review and finance leadership through a virtual CFO. We do not sell software and we do not earn commission on it.
The next 90 days
Days 1 to 30: build the baseline. Extract twelve months of receivables, inventory, discounts and finance team workload. Compute receivable days, stock days, the discount rate and the close date. Most companies learn something from this step alone.
Days 31 to 60: size and choose. List candidate use cases. Put each in one of the four categories with a rupee estimate and a confidence rating. Cost them fully. Choose two: one with high confidence and modest value, one with higher value that tests the organisation.
Days 61 to 90: pilot with a comparison. Run each in part of the business. Measure against the baseline and the comparison group. Report to the board in cash terms. Decide to extend, change or stop.
If the baseline shows that the company cannot yet measure receivable days by customer or margin by item, that is the finding, and the first investment is in the books, not in AI (data before algorithms).
Frequently asked questions
Is AI worth it for a company with sales under NPR 20 crore?
Often yes, at a smaller scale. The cheapest uses, drafting, summarising, formula writing and invoice capture inside existing software, cost little and need no project. The analytical uses need enough transactions to find patterns in, which most trading and service businesses of that size have.
Why not count the salary savings?
Count them when a post is actually removed or a planned hire is not made. Otherwise the saved hours are capacity, and their value depends on what management does with them. In a low-wage economy even real headcount savings are small beside the cost of money.
How long before we see a return?
Expect cost in the first two quarters and gain from the third. A programme judged at month four will usually look like a failure.
What is a reasonable target?
For a trading company, releasing five days of receivables and a few days of stock is achievable with good data and follow-through. For most mid-sized companies a net gain of 0.3 to 0.6 per cent of sales in the second year is a sound planning figure. Treat anything above that as a hypothesis to be tested.
Can we use free tools to start?
For drafting and learning, yes, with care about what data goes in. For anything involving customer, payroll or pricing data, use an account the company controls and whose terms it has read.
Do we need a data scientist?
Not for the use cases above. They need a finance person who understands the business, a clean ledger and a tool that is already on the market. A specialist becomes useful when the company has exhausted what packaged tools can do.
How should the gain be reported to the board?
In a single table: use case, category, baseline, current measure, cash effect confirmed to the bank or ledger, cost to date. Avoid percentages without rupee amounts.
What if the pilot shows no gain?
Then it has done its job cheaply. Find out whether the cause was the data, the adoption or the idea. The first two can be fixed. The third should be dropped.
*This article is general guidance, not financial advice. The worked example is hypothetical and its assumptions should be replaced with your own figures. Survey results are quoted from the published sources listed and reflect mainly large companies outside Nepal.*